
CloudWatchエージェントの導入

保守業務を主とした業務を生業としているため、監視ツールを利用しています。
その中でもZabbixを主に利用してますが、オープンソースであり導入も比較的簡単で導入後はWebインターフェースから監視項目を設定していくだけ、エージェントを監視対象機器に導入することで細かな監視設定が可能と使い勝手が良く、開発元もオープンソースなのにコミュニティ等ではなく企業が開発しているので日々バージョンアップを重ねています。
Zabbixを重宝していましたが、クラウドの波に押されクラウド監視について今回は調べてみたいと思います。今回はAWSサービスのEC2導入する機会があったのでAWS CloudWatch(クラウドウォッチ)についてです。Zabbixを導入して監視を検討しましたが折角ですのでAWSサービスでやってみようと思います。
導入
まずEC2(Amazon Elastic Compute Cloud)とはAWSの仮想サーバーになり、単位はインスタンス。
EC2インスタンスにAmazonのOSのAmazon Linux 2を導入した環境にAWS CloudWatchで監視設定しようと思います。
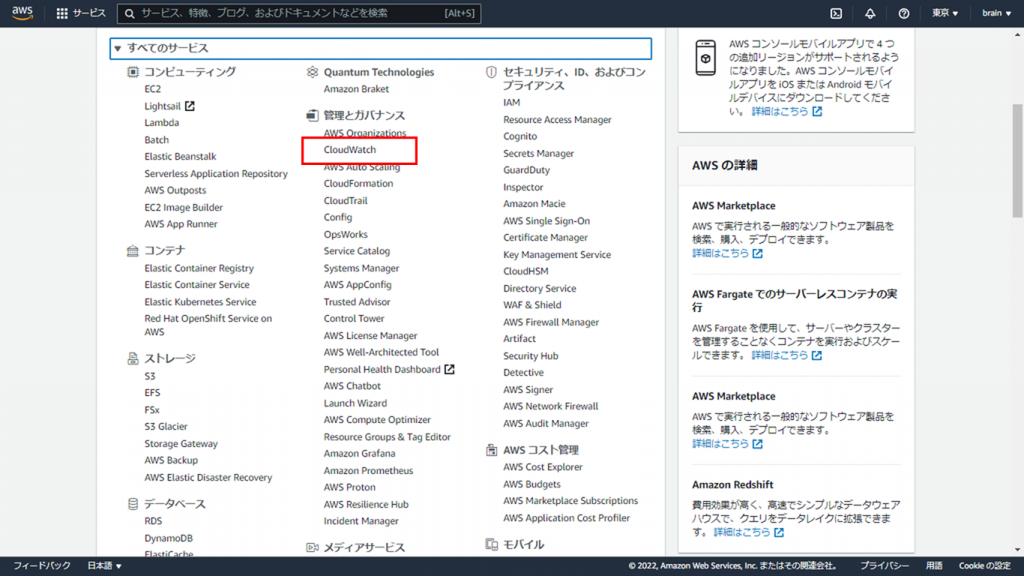
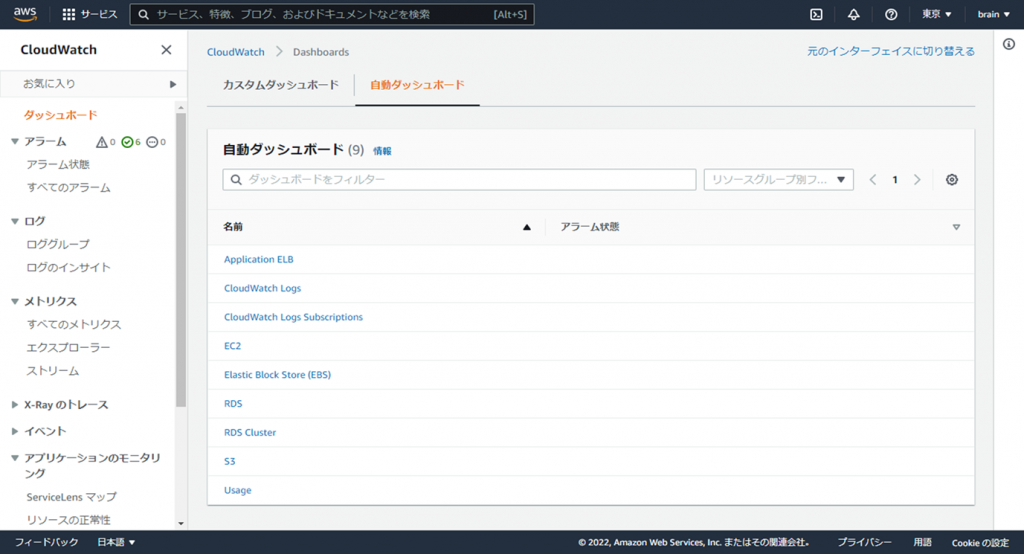
AWSサービスを利用した時点でCloudWatchは使えていました。サービス検索で「CloudWatch」を入力しても良いですが、こちらをクリック。
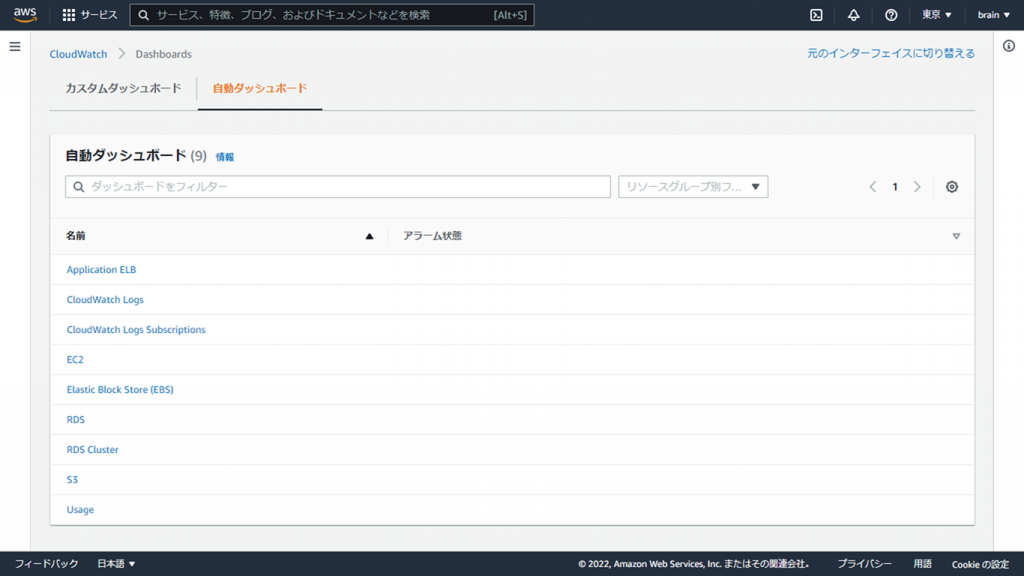
特に設定していない状態なのでダッシュボードには何も表示されませんので自動ダッシュボードを表示します。「EC2」を見てみます。
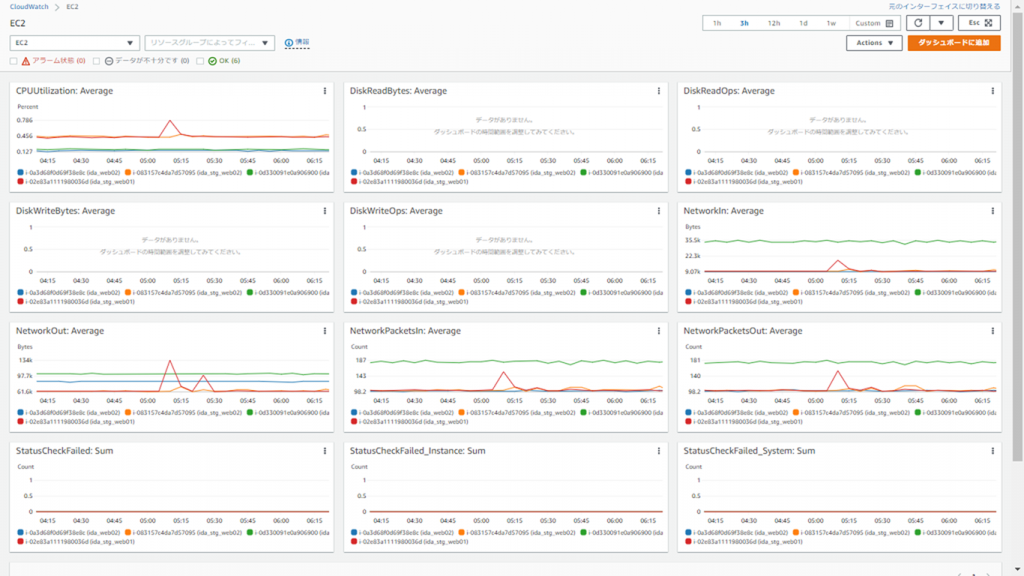
各グラフに項目名が記載されていてこれをメトリクスと呼びます。上記グラフ群はそのEC2に対しての全メトリクスを表示しています。お気付きの方がいるかも知れませんが、そう、主に監視したい項目がCPUくらいしかないのです。あとはネットワークトラフィック位でしょうが特段監視したい項目ではないですね。監視するにあたり、CPU、メモリ、ディスクサイズは欲しいですね。
ここで登場するのがCloudWatchエージェント。CloudWatchエージェントを導入してカスタムメトリクスを追加する必要がありそうです。
CloudWatchエージェントの導入
CloudWatchAgentServerPolicyの適用
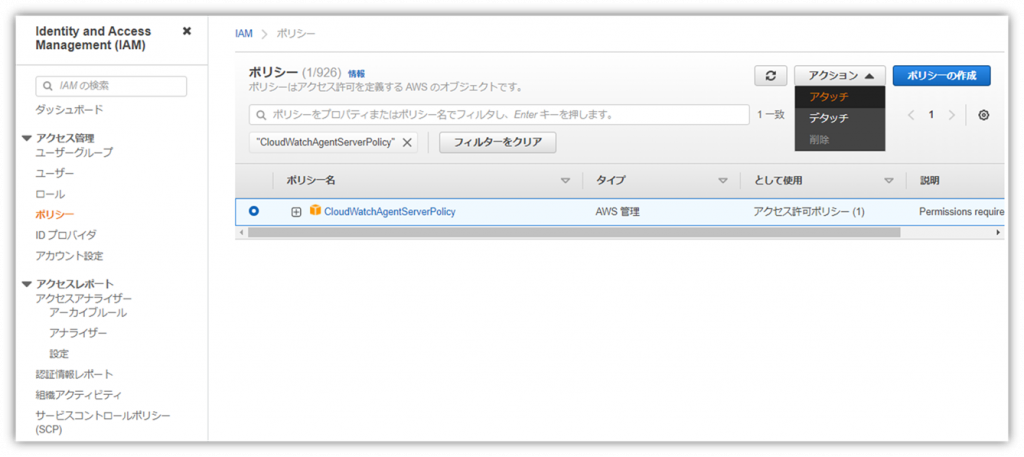
CloudWatchエージェントを導入するにはIAMロールにCloudWatchAgentServerPolicyポリシーの適用が必要になります。IAMのサービスからポリシー検索で「CloudWatchAgentServerPolicy」をアクション→アタッチでIAMユーザーにアタッチします。※ここでは既にIAMロールが設定されている前提でポリシーの追加としています。
CloudWatch エージェントのインストール
上記でも述べていますが、ここではAmazon Linux 2に対しての導入になります。CentOSなどほかの場合は手順が異なりますのでご了承ください。EC2のコンソールから以下コマンドでCloudWatch エージェントをインストール。
# sudo yum install amazon-cloudwatch-agent
自動起動設定
# sudo systemctl enable amazon-cloudwatch-agent
ステータス確認
# sudo systemctl status amazon-cloudwatch-agent
● amazon-cloudwatch-agent.service – Amazon CloudWatch Agent
Loaded: loaded (/etc/systemd/system/amazon-cloudwatch-agent.service; enabled; vendor preset: disabled)
Active: inactive (dead)
#
EPEL リポジトリインストール
collectdを使用してメモリなどのカスタムメトリクスを取得するためcollectdをインストールします。まずcollectdを有効にするためEPELリポジトリをインストールします。
# sudo amazon-linux-extras install epel
有効化
# sudo yum-config-manager –enable epel
collectdインストール
# sudo yum install collectd
準備OK、次は設定です。
CloudWatch エージェントの設定
# sudo /opt/aws/amazon-cloudwatch-agent/bin/amazon-cloudwatch-agent-config-wizard
=============================================================
= Welcome to the AWS CloudWatch Agent Configuration Manager =
=============================================================
On which OS are you planning to use the agent?
1. linux
2. windows
3. darwin
default choice: [1]:
Trying to fetch the default region based on ec2 metadata…
Are you using EC2 or On-Premises hosts?
1. EC2
2. On-Premises
default choice: [1]:
Which user are you planning to run the agent?
1. root
2. cwagent
3. others
default choice: [1]:
Do you want to turn on StatsD daemon?
1. yes
2. no
default choice: [1]:
Which port do you want StatsD daemon to listen to?
default choice: [8125]
What is the collect interval for StatsD daemon?
1. 10s
2. 30s
3. 60s
default choice: [1]:
What is the aggregation interval for metrics collected by StatsD daemon?
1. Do not aggregate
2. 10s
3. 30s
4. 60s
default choice: [4]:
Do you want to monitor metrics from CollectD?
1. yes
2. no
default choice: [1]:
Do you want to monitor any host metrics? e.g. CPU, memory, etc.
1. yes
2. no
default choice: [1]:
Do you want to monitor cpu metrics per core? Additional CloudWatch charges may apply.
1. yes
2. no
default choice: [1]:
Do you want to add ec2 dimensions (ImageId, InstanceId, InstanceType, AutoScalingGroupName) into all of your metrics if the info is available?
1. yes
2. no
default choice: [1]:
Would you like to collect your metrics at high resolution (sub-minute resolution)? This enables sub-minute resolution for all metrics, but you can customize for specific metrics in the output json file.
1. 1s
2. 10s
3. 30s
4. 60s
default choice: [4]:
Which default metrics config do you want?
1. Basic
2. Standard
3. Advanced
4. None
default choice: [1]:
Current config as follows:
{
“agent”: {
“metrics_collection_interval”: 60,
“run_as_user”: “root”
},
“metrics”: {
“append_dimensions”: {
“AutoScalingGroupName”: “${aws:AutoScalingGroupName}”,
“ImageId”: “${aws:ImageId}”,
“InstanceId”: “${aws:InstanceId}”,
“InstanceType”: “${aws:InstanceType}”
},
“metrics_collected”: {
“collectd”: {
“metrics_aggregation_interval”: 60
},
“disk”: {
“measurement”: [
“used_percent”
],
“metrics_collection_interval”: 60,
“resources”: [
“*”
]
},
“mem”: {
“measurement”: [
“mem_used_percent”
],
“metrics_collection_interval”: 60
},
“statsd”: {
“metrics_aggregation_interval”: 60,
“metrics_collection_interval”: 10,
“service_address”: “:8125”
}
}
}
}
Are you satisfied with the above config? Note: it can be manually customized after the wizard completes to add additional items.
1. yes
2. no
default choice: [1]:
Do you have any existing CloudWatch Log Agent (http://docs.aws.amazon.com/AmazonCloudWatch/latest/logs/AgentReference.html) configuration file to import for migration?
1. yes
2. no
default choice: [2]:
Do you want to monitor any log files?
1. yes
2. no
default choice: [1]:
Log file path:
Log group name:
default choice: [.]
Log stream name:
default choice: [{instance_id}]
Do you want to specify any additional log files to monitor?
1. yes
2. no
default choice: [1]:
2
Saved config file to /opt/aws/amazon-cloudwatch-agent/bin/config.json successfully.
Current config as follows:
{
“agent”: {
“metrics_collection_interval”: 60,
“run_as_user”: “root”
},
“logs”: {
“logs_collected”: {
“files”: {
“collect_list”: [
{
“file_path”: “”,
“log_group_name”: “.”,
“log_stream_name”: “{instance_id}”
},
{
“file_path”: “”,
“log_group_name”: “.”,
“log_stream_name”: “{instance_id}”
},
{
“file_path”: “”,
“log_group_name”: “.”,
“log_stream_name”: “{instance_id}”
},
{
“file_path”: “”,
“log_group_name”: “.”,
“log_stream_name”: “{instance_id}”
},
{
“file_path”: “”,
“log_group_name”: “.”,
“log_stream_name”: “{instance_id}”
},
{
“file_path”: “”,
“log_group_name”: “.”,
“log_stream_name”: “{instance_id}”
},
{
“file_path”: “”,
“log_group_name”: “.”,
“log_stream_name”: “{instance_id}”
},
{
“file_path”: “”,
“log_group_name”: “.”,
“log_stream_name”: “{instance_id}”
},
{
“file_path”: “”,
“log_group_name”: “.”,
“log_stream_name”: “{instance_id}”
},
{
“file_path”: “”,
“log_group_name”: “.”,
“log_stream_name”: “{instance_id}”
},
{
“file_path”: “”,
“log_group_name”: “.”,
“log_stream_name”: “{instance_id}”
},
{
“file_path”: “”,
“log_group_name”: “.”,
“log_stream_name”: “{instance_id}”
},
{
“file_path”: “”,
“log_group_name”: “.”,
“log_stream_name”: “{instance_id}”
},
{
“file_path”: “”,
“log_group_name”: “.”,
“log_stream_name”: “{instance_id}”
},
{
“file_path”: “”,
“log_group_name”: “.”,
“log_stream_name”: “{instance_id}”
},
{
“file_path”: “”,
“log_group_name”: “.”,
“log_stream_name”: “{instance_id}”
},
{
“file_path”: “”,
“log_group_name”: “.”,
“log_stream_name”: “{instance_id}”
},
{
“file_path”: “”,
“log_group_name”: “.”,
“log_stream_name”: “{instance_id}”
}
]
}
}
},
“metrics”: {
“append_dimensions”: {
“AutoScalingGroupName”: “${aws:AutoScalingGroupName}”,
“ImageId”: “${aws:ImageId}”,
“InstanceId”: “${aws:InstanceId}”,
“InstanceType”: “${aws:InstanceType}”
},
“metrics_collected”: {
“collectd”: {
“metrics_aggregation_interval”: 60
},
“disk”: {
“measurement”: [
“used_percent”
],
“metrics_collection_interval”: 60,
“resources”: [
“*”
]
},
“mem”: {
“measurement”: [
“mem_used_percent”
],
“metrics_collection_interval”: 60
},
“statsd”: {
“metrics_aggregation_interval”: 60,
“metrics_collection_interval”: 10,
“service_address”: “:8125”
}
}
}
}
Please check the above content of the config.
The config file is also located at /opt/aws/amazon-cloudwatch-agent/bin/config.json.
Edit it manually if needed.
Do you want to store the config in the SSM parameter store?
1. yes
2. no
default choice: [1]:
2
Program exits now.
#
基本デフォルト値で問題ありませんでしたが、以下2つはNOとしました。
Do you want to specify any additional log files to monitor?
Do you want to store the config in the SSM parameter store?
また、上記ではディスクサイズを取得できませんでした。
Which default metrics config do you want?
1. Basic
2. Standard
3. Advanced
4. None
default choice: [1]:
ここはデフォルトの「1. Basic」ではなく「2. Standard」にする必要がありました。
起動
# sudo /opt/aws/amazon-cloudwatch-agent/bin/amazon-cloudwatch-agent-ctl -a fetch-config -m ec2 -s -c file:/opt/aws/amazon-cloudwatch-agent/bin/config.json
起動確認
# sudo systemctl status amazon-cloudwatch-agent
● amazon-cloudwatch-agent.service – Amazon CloudWatch Agent
Loaded: loaded (/etc/systemd/system/amazon-cloudwatch-agent.service; enabled; vendor preset: disabled)
Active: active (running) since Sun 2022-03-06 17:51:31 JST; 2min 52s ago
Main PID: 7697 (amazon-cloudwat)
CGroup: /system.slice/amazon-cloudwatch-agent.service
mq7697 /opt/aws/amazon-cloudwatch-agent/bin/amazon-cloudwatch-agent -config /opt/aws/amazon-cloudwatch-agent/etc/amazon-cloudwatch-agent.toml -envconfig /…
Mar 06 17:51:31 ida_web01 systemd[1]: Started Amazon CloudWatch Agent.
Mar 06 17:51:31 ida_web01 start-amazon-cloudwatch-agent[7697]: /opt/aws/amazon-cloudwatch-agent/etc/amazon-cloudwatch-agent.json does not exist or cannot rea…ping it.
Mar 06 17:51:31 ida_web01 start-amazon-cloudwatch-agent[7697]: Valid Json input schema.
Mar 06 17:51:31 ida_web01 start-amazon-cloudwatch-agent[7697]: I! Detecting run_as_user…
Hint: Some lines were ellipsized, use -l to show in full.
#
コンソール作業は以上。次はAWSのWebコンソールからです。
ダッシュボード
自動ダッシュボード上には特に変化ありませんね。
メトリクス
ここに今回追加した「CWAgent」が表示されていました。
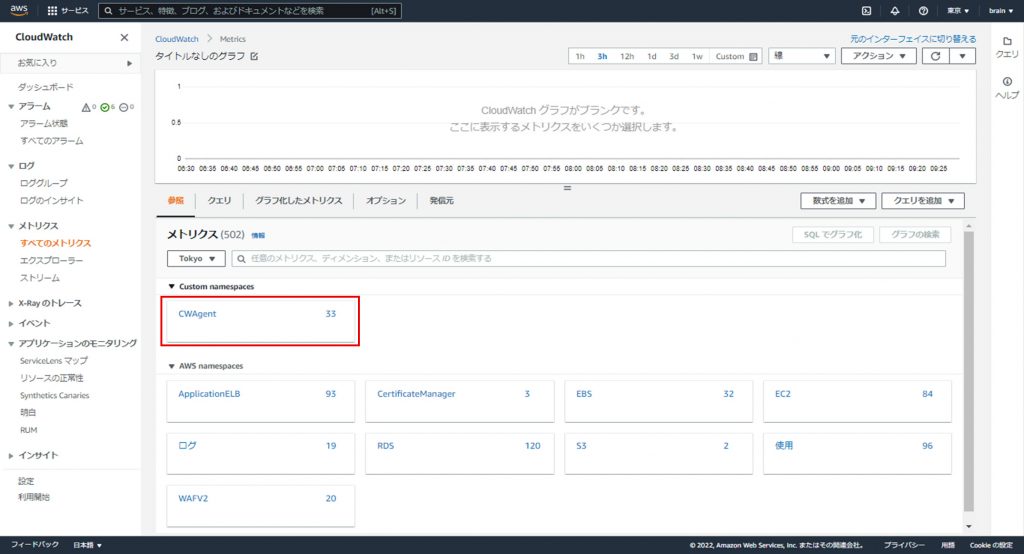
CWAgent
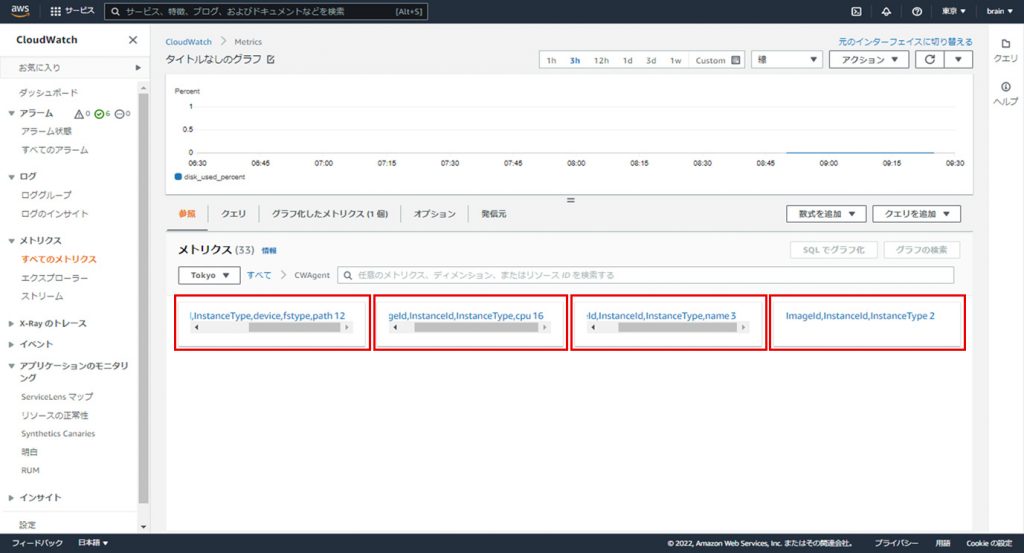
ちょっとわかりずらいですが、4つのメトリクスが追加されていました。左から、デバイス、CPU、ディスクIO、メモリとスワップ。これらのメトリクスから必要な部分を抽出してグラフ化してみます。
ディスク使用量(MB)
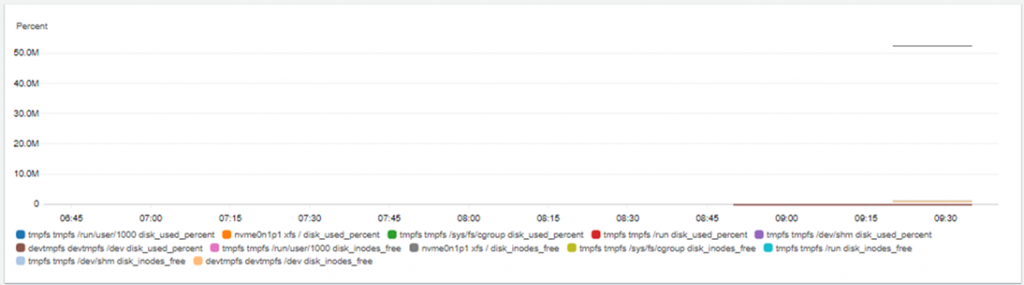
メモリ使用量(%)
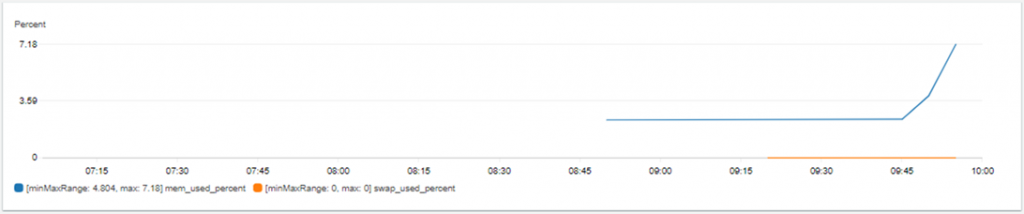
何とかメモリ、ディスクサイズを監視できる準備ができました。CloudWatchでアラート設定も出来るので設定していこうと思いますが、今回はここまでです。
オンプレミスサーバーでもCloudWatchエージェントさえ導入すれば監視ができるようですので監視サーバ導入コスト削減もできそうです。
サーバの監視にお困りなら…いっそ任せてみませんか?
ブレーンアシストでは貴社のインフラ部門のようにお客様をサポートいたします。弊社は高度な技術と豊富な経験を持つチームがお客様のニーズに対応した保守運用ソリューション「スーパーメンテナンス」を提供しています。信頼と品質に基づく当サービスをアウトソーシングの選択肢の一つとしてご検討いただければ幸いです。

 (1 いいね)